


Any new focus programs at Lincoln Public Schools should be embedded into the high schools and not at separate locations, a district task force concluded.
The task force also concluded the programs are popular with students who participate in them, and found that those students do well academically.
“The existing focus programs at LPS are, overall, effective,” said Matt Larson, associate superintendent of instruction. “Those programs help students connect more thoroughly to schools and higher engagement helps with the graduation rate.”
But embedding programs in the high schools would eliminate both transportation issues and logistical problems for students who participate in programs such as chorus or band at their home high schools, he said.
Embedding them in existing high schools also would increase participation, said Superintendent Steve Joel.
People are also reading…
The task force also found there's a desire for more programs, more partnerships with the community, and more online learning opportunities.
To that end, district officials are investigating ways to expand online learning, Larson said.
Now, online classes are offered primarily for credit recovery. Larson said LPS would like to expand opportunities for students to take additional classes that won't fit into the regular day or are needed to provide flexibility for jobs or other responsibilities.��
Larson said the district is reviewing various software programs to see which ones line up best with the district's curriculum. Once officials find one, they'll decide which classes would be appropriate to offer online.��
It's likely any additional online classes would be offered at school, so students would have the support of teachers, Larson said.
The task force — comprised of district officials��— reviewed existing programs, did surveys of parents and students and visited focus, magnet and academy programs in Dallas, Chicago, Grand Island, Omaha and Sioux Falls, South Dakota.
The programs evaluated include: the Arts and Humanities and Science Focus programs, The Career Academy, the International Baccalaureate (IB) program at Lincoln High and the Junior ROTC program at Northeast.
It didn’t include the Bryan program, an alternative high school program, which also has been called a focus program but doesn't offer a specific curricular focus.
In online surveys, students who participate in focus programs and their parents generally gave the programs high marks.
For instance, between 67 and 88 percent of students said they were more motivated in the focus programs. A majority also liked the focus programs better than attending their regular high school and said they had stronger relationships with their teachers.
Other conclusions of the task force:
*��None of the focus programs are operating at capacity. Arts and Humanities is at 67 percent, the Science Focus��— known as zoo school��— at 78 percent, The Career Academy at 50 percent and the Junior ROTC program at 54 percent. The IB program has 188 students and enrollment is driven by staffing levels.
Larson said capacity levels aren't a concern. The only program with significant space is The Career Academy, but it saw a 30 percent increase last fall and is expected to increase next year. That's happened in part because of a targeted marketing campaign aimed at students, he said.��
*��Retention is an issue at many of the programs and should be examined. Retention is 36 percent at Arts and Humanities, 48 percent at Science Focus, 58 percent at The Career Academy, 12 percent at the Junior ROTC, and 100 percent for juniors and seniors in the IB program. Larson said students leaving the program will be given an exit survey to find out why they decided to leave.
*��The average graduation rate in all the programs is at or higher than the district average for students. Between 74 and 86 percent of students who participate in the IB program��— an academically rigorous program offered at schools across the country��— earn degrees through the program. That’s higher than the national average of 65 percent, Larson said.
*��Students in the focus programs generally perform better on the ACT than their counterparts in traditional high schools, though it depends on the subject area. LPS compared the focus program students’ scores to a random group made up of students with similar demographics.
The task force identified a number of areas to consider for additional focus programs, some of which are similar to pathways offered at The Career Academy.
Larson said if additional focus programs were developed in those areas they would complement, not replace, The Career Academy programs.
Those areas include: construction and manufacturing, global business, aeronautics, human sciences, health sciences, natural resources and agriculture, and information and technology systems.
Board of Education member Annie Mumgaard urged district officials not to forget the arts when considering new focus programs.
A community task force that will make recommendations for new construction or improvements that should be included in a bond issue will get the report to review. Work on additional focus programs won't begin until a decision is made about a new high school or high schools.��
Breaking down Lincoln's public schools
Breaking down Lincoln's public schools: Enrollment, test scores and more
Adams

Adams Elementary: 7401 Jacobs Creek Drive
Enrollment: 776 students
77.9% white, 2.3% Black or African American, 9.6% Asian, 4.9% Hispanic/Latino, 5.4% two or more races
Free and reduced-price lunch participation:��8.6% free, 2.3% reduced
Gifted students:��10.4%
Statewide test scores (percent who meet or exceed standards):��73 language arts; 76 math
Arnold
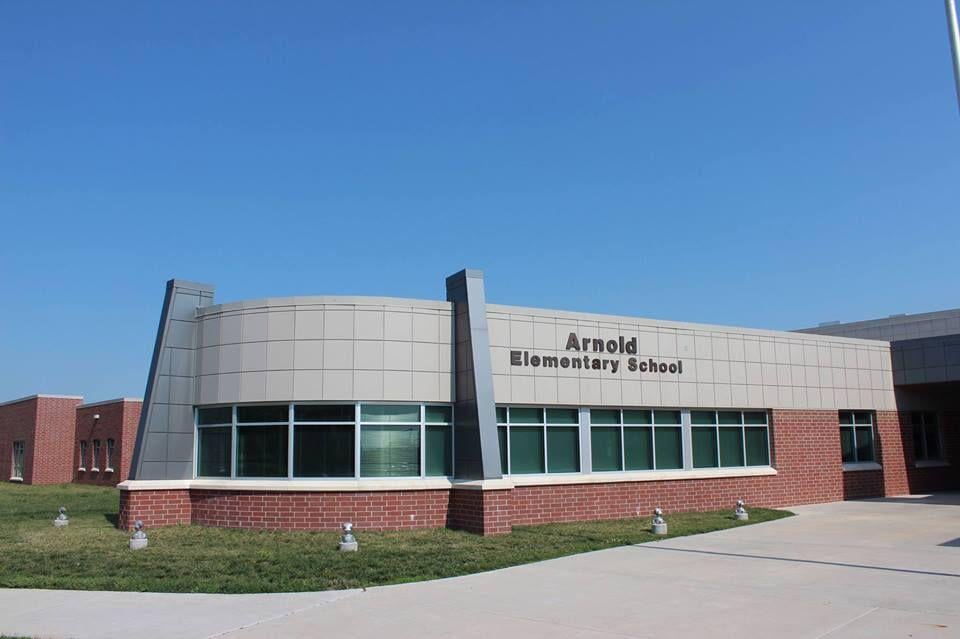
Arnold Elementary: 5000 Mike Scholl St.
Enrollment: 742 students
57.1% white, 1.5% American Indian or Alaska Native, 8.4% Black or African American, 1.5% Asian, 19.2% Hispanic/Latino, 0.3% Native Hawaiian or Pacific Islander, 12% two or more races
Free and reduced-price lunch participation:��46.7% free, 12.7% reduced
Gifted:��2.8%
Statewide test scores (percent who meet or exceed standards):��44 language arts, 32 math
Beattie

Beattie Elementary: 1901 Calvert St.
Enrollment: 368 students
73.6% white, 0.5% American Indian or Alaska Native, 3.3% Black or African American, 1.1% Asian, 8.2% Hispanic/Latino, 13.3% two or more races
Free or reduced-price lunch participation: 25.3% free, 8.2% reduced price
Gifted:��6.0%
Statewide test scores (percent who meet or exceed standards):��59 language arts, 55 math
Belmont

Belmont Elementary:��3425 N. 14th St.
Enrollment:��829 students
42.4% white, 0.9% American Indian or Alaska Native, 15.7% Black or African American, 2.2% Asian, 26.9% Hispanic/Latino, 11.8% two or more races
Free and reduced-price lunch participation: 67.5% free, 11.0% reduced
Gifted:��3.7%
Statewide test scores (percent who meet or exceed standards):��44 language arts, 34 math
Brownell
Brownell Elementary: 6000 Aylesworth Ave.
Enrollment: 320 students
65.9% white, 4.9% Black or African American, 0.3% Asian, 14.8% Hispanic/Latino, 14.1% two or more races
Free and reduced-price lunch participation:��45.2% free, 10.5% reduced
Gifted:��2.3%
Statewide test scores (percent who meet or exceed standards):��50 language arts, 37 math
Calvert
Calvert Elementary: 3709 S. 46th St.
Enrollment: 361 students
62.9% white, 1.2% American Indian or Alaska Native, 7.1% Black or African American, 1.5% Asian, 12.0% Hispanic/Latino, 15.3% two or more races
Free and reduced-price lunch participation: 45.7% free, 6.7% reduced
Gifted:��11.3%
Statewide test scores (percent who meet or exceed standards):��47 language arts, 31 math
Campbell

Campbell Elementary: 2200 Dodge St.
Enrollment: 591 students
46.6% white, 0.4% American Indian or Alaska Native, 14.3% Black or African American, 11.3% Asian, 16.6% Hispanic/Latino, 10.9% two or more races
Free and reduced-price lunch participation: 59.4% free, 10.5% reduced
Gifted: 4.2%
Statewide test scores (percent who meet or exceed standards):��38 language arts, 34 math
Cavett
Cavett Elementary: 7701 S. 36th St.
Enrollment: 580 students
77.0% white, 0.5% American Indian or Alaska Native, 2.9% Black or African American, 4.0% Asian, 8.9% Hispanic, 6.6% two or more races
Free and reduced-price lunch participation:��10.4% free, 3.6% reduced
Gifted: 13.3%
Statewide test scores (percent who meet or exceed standards):��70 language arts, 69 math
Clinton
Clinton Elementary: 1520 N. 29th St.
Enrollment:��392 students
39.2% white, 0.3% American Indian or Alaska Native, 24.3% Black or African American, 4.7% Asian, 21.0% Hispanic/Latino, 10.5% two or more races
Free and reduced-price lunch participation: 81.2% free, 10.5% reduced
Gifted:��3.6%
Statewide test scores (percent who meet or exceed standards):��30 language arts, 30 math��
Eastridge

Eastridge Elementary: 6245 L St.
Enrollment:��291 students
72.9% white, 1.0% American Indian or Alaska Native, 4.5% Black or African American, 1.4% Asian, 10.3% Hispanic/Latino, 10.0% two or more races
Free and reduced-price lunch participation:��25.8% free, 10.0% reduced
Gifted:��7.9%
Statewide test scores (percent who meet or exceed standards):��55 language arts, 51 math
Elliott
Elliott Elementary: 225 S. 25th St.
Enrollment: 383 students
23.3% white, 1.8% American Indian or Alaska Native, 13.7% Black or African American, 12.8% Asian, 33.7% Hispanic/Latino, 0.3% Native Hawaiian or Pacific Islander, 14.3% two or more races
Free and reduced-price lunch participation: 76.4% free, 6.3% reduced
Gifted:��4.5%
Statewide test scores (percentage who meet or exceed standards):��42 language arts, 35 math
Everett
Everett Elementary: 1123 C St.
Enrollment: 374 students
27.8% white, 0.9% American Indian or Alaska Native, 13.5% Black or African American, 9.9% Asian, 40.4% Hispanic/Latino, 7.5% two or more races
Free and reduced-price lunch participation:��73.7% free, 8.7% reduced
Gifted:��5.4%
Statewide test scores (percentage who meet or exceed standards): 37 language arts, 24 math
Fredstrom

Fredstrom Elementary, 5700 N.W. 10th St.
Enrollment: 437 students
74.0% white, 0.5% American Indian or Alaska Native, 1.7% Black or African American, 3.6% Asian, 9.7% Hispanic, 10.4% two or more races
Free and reduced-price lunch participation: 22.3% free, 6.3% reduced
Gifted: 7.5%
Statewide test scores (percentage who meet or exceed standards):��52 language arts, 54 math
Hartley

Hartley Elementary, 730 N. 33rd St.
Enrollment:��339 students
37.5% white, 2.3% American Indian or Alaska Native, 17.5% Black or African American, 3.6% Asian, 25.9% Hispanic/Latino, 1.0% Native Hawaiian or Pacific Islander, 12.3% two or more races
Free and reduced-price lunch participation: 71.5% free, 9.4% reduced
Gifted:��3.2%
Statewide test scores (percentage who meet or exceed standards):��38 language arts, 28 math
Hill

Hill Elementary, 5230 Tipperary Trail
Enrollment:��449 students
72.2% white, 0.5% American Indian or Alaska Native, 4.8% Black or African American, 5.3% Asian, 10.3% Hispanic/Latino, 7.0% two or more races
Free and reduced-price lunch participation: 24.0% free, 5.0% reduced
Gifted: 10.3%
Statewide test scores (percentage who meet or exceed standards):��70 language arts, 59 math
Holmes

Holmes Elementary, 5230 Sumner St.
Enrollment: 393 students
70.7% white, 3.5% Black or African American, 3.5% Asian, 10.1% Hispanic/Latino, 0.3% Native Hawaiian or Pacific Islander, 11.9% two or more races
Free and reduced-price lunch participation:��37.1% free, 7.0% reduced
Gifted:��11.3%
Statewide test scores (percentage who meet or exceed standards):��61 language arts, 47 math
Humann
Humann Elementary,��6720 Rockwood Lane
Enrollment:��564 students
78.8% white, 0.6% American Indian or Alaska Native, 4.2% Black or African American, 1.3% Asian, 5.9% Hispanic/Latino, 9.3% two or more races
Free and reduced-price lunch participation: 23.9% free, 4.0% reduced
Gifted:��16.3%
Statewide test scores (percentage who meet or exceed standards):��72 language arts, 67 math
Huntington
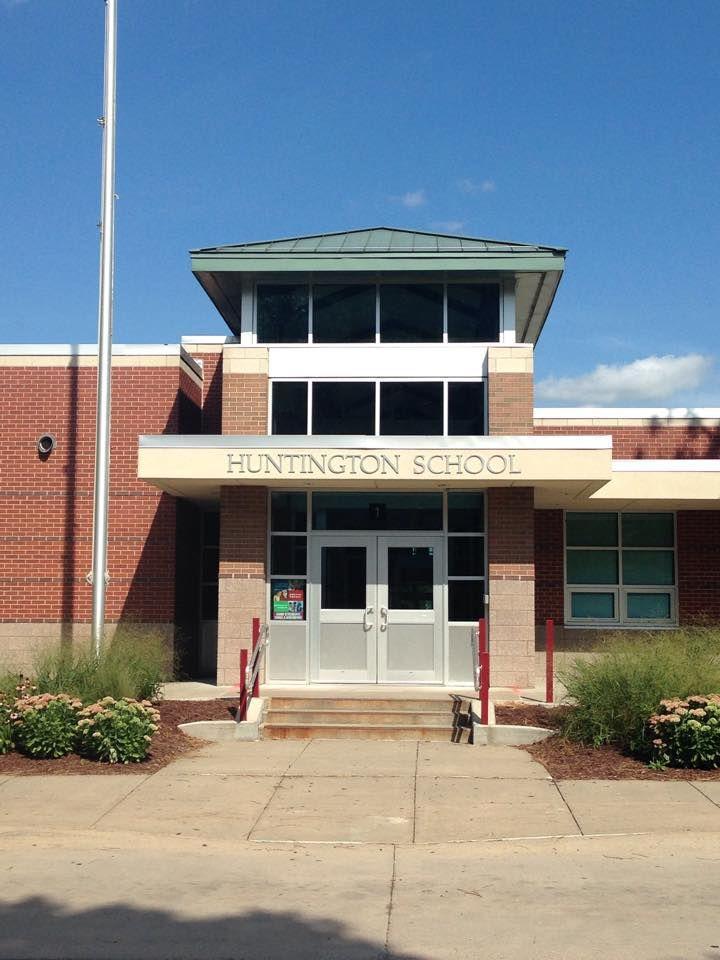
Huntington Elementary, 2900 N. 46th St.
Enrollment: 370 students
45.0% white, 0.6% American Indian or Alaska Native, 12.0% Black or African American, 1.5% Asian, 24.6% Hispanic/Latino, 16.2% two or more races
Free and reduced-price lunch participation:��67.0% free, 14.1% reduced
Gifted:��4.8%
Statewide test scores (percentage who meet or exceed standards):��32 language arts, 23 math
Kahoa

Kahoa Elementary, 7700 Leighton Ave.
Enrollment: 537 students
78.8% white, 0.4% American Indian or Alaska Native, 3.9% Black or African American, 2.6% Asian, 6.7% Hispanic/Latino, 7.6% two or more races
Free and reduced-price lunch participation: 22.9% free, 7.3% reduced
Gifted:��6.9%
Statewide test scores (percentage who meet or exceed standards):��66 language arts, 64 math
Kloefkorn
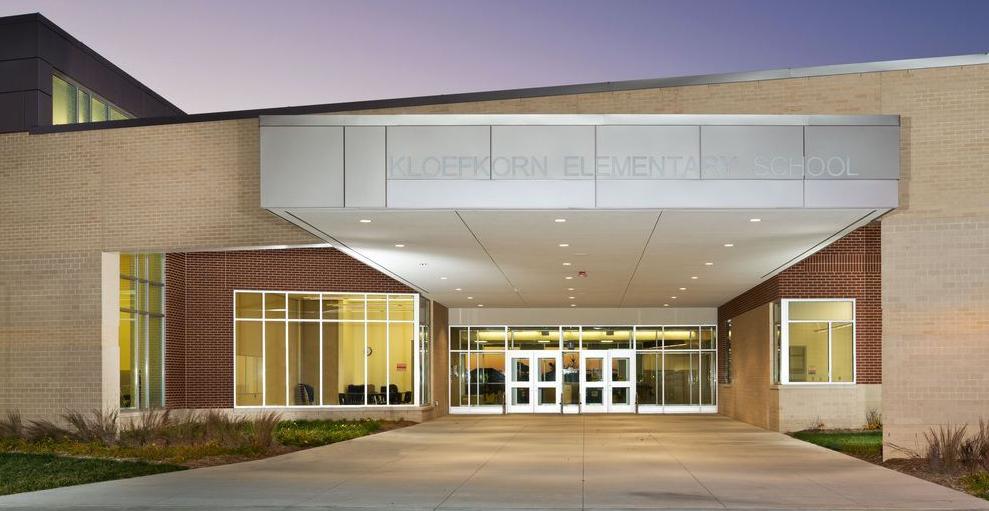
Kloefkorn Elementary, 6601 Glass Ridge Drive
Enrollment:��488 students
83.7% white, 0.7% American Indian or Alaska Native, 1.5% Black or African American, 4.4% Asian, 5.3% Hispanic/Latino, 4.4% two or more races
Free and reduced-price lunch participation:��6.2% free, 2.0% reduced
Gifted: 11.9%
Statewide test scores (percentage who meet or exceed standards):��77 language arts, 72 math
Kooser

Kooser Elementary, 7301 N. 13th St.
Enrollment:��821 students
63.5% white, 0.1% American Indian or Alaska Native, 5.6% Black or African American, 11.9% Asian, 11.1% Hispanic/Latino, 0.1% Native Hawaiian or Pacific Islander, 7.6% two or more races
Free and reduced-price lunch participation:��30.0% free, 8.3% reduced
Gifted: 2.9%
Statewide test scores (percentage who meet or exceed standards): 55 language arts, 49 math
Lakeview

Lakeview Elementary, 300 Capitol Beach Blvd.
Enrollment:��400 students
53.0% white, 0.8% American Indian or Alaska Native, 9.3% Black or African American, 3.8% Asian, 22.8% Hispanic/Latino, 10.5% two or more races
Free and reduced-price lunch participation: 57.0% free, 9.5% reduced
Gifted: 1.8%
Statewide test scores (percentage who meet or exceed standards): 35��language arts, 29 math
Maxey

Maxey Elementary, 5200 S. 75th St.
Enrollment: 683 students
75.9% white, 0.3% American Indian or Alaska Native, 1.2% Black or African American, 13.5% Asian, 3.4% Hispanic/Latino, 0.2% Native Hawaiian or Pacific Islander, 5.5% two or more races
Free and reduced-price lunch participation: 10.6% free, 3.4% reduced
Gifted: 10.4%
Statewide test scores (percentage who meet or exceed standards):��70 language arts, 69 math
McPhee

McPhee Elementary, 820 Goodhue Blvd.
Enrollment:��304 students
26.8% white, 1.4% American Indian or Alaska Native, 16.3% Black or African American, 12.7% Asian, 35.9% Hispanic/Latino and 6.9% two or more races
Free and reduced-price lunch participation: 77.2% free, 6.9% reduced
Gifted:��4.0%
Statewide test scores (percentage who meet or exceed standards):��36 language arts, 22 math
Meadow Lane

Meadow Lane Elementary,��7200 Vine St.
Enrollment:��620 students
72.1% white, 0.2% American Indian or Alaska Native, 2.8% Black or African American, 2.6% Asian, 13.8% Hispanic/Latino, 8.6% two or more races
Free and reduced-price lunch participation: 33.6% free, 8.1% reduced
Gifted:��8.3%
Statewide test scores (percentage who meet or exceed standards):��51 language arts, 39 math
Morley

Morley Elementary, 6800 Monterey Drive
Enrollment:��421 students
78.1% white, 0.2% American Indian or Alaska Native, 3.8% Black or African American, 0.2% Asian, 7.4% Hispanic, 0.5% Native Hawaiian or Pacific Islander, 9.7% two or more races
Free and reduced-price lunch participation:��20.2% free, 5.5% reduced
Gifted: 15.4%
Statewide test scores (percentage who meet or exceed standards): 69��language arts, 56 math
Norwood Park
Norwood Park Elementary, 4710 N. 72nd St.
Enrollment: 238 students
68.0% white, 4.4% Black or African American, 2.4% Asian, 18.9% Hispanic/Latino, 6.3% two or more races
Free and reduced-price lunch participation: 46.6% free, 15.0% reduced
Gifted:��4.9%
Statewide test scores (percentage who meet or exceed standards):��43 language arts, 30 math
Pershing

Pershing Elementary, 6402 Judson St.
Enrollment: 430 students
57.5% white, 0.5% American Indian or Alaska Native, 6.6% Black or African American, 3.3% Asian, 20.6% Hispanic/Latino, 11.5% two or more races
Free and reduced-price lunch participation: 54.5% free, 12.7% reduced
Gifted:��4.3%
Statewide test scores (percentage who meet or exceed standards):��49 language arts, 50 math
Prescott

Prescott Elementary, 1930 S. 20th St.
Enrollment: 492 students
44.9% white, 0.9% American Indian or Alaska Native, 13.8% Black or African American, 7.3% Asian, 18.8% Hispanic/Latino, 0.5% Native Hawaiian or Pacific Islander, 13.8% two or more races
Free and reduced-price lunch participation: 51.2% free, 9.5% reduced
Gifted: 7.5%
Statewide test scores (percentage who meet or exceed standards):��52 language arts, 36 math
Pyrtle
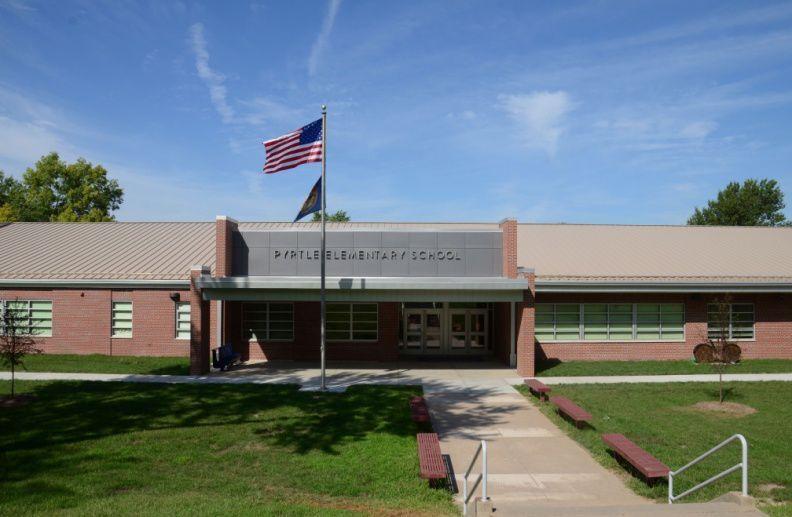
Pyrtle Elementary, 721 Cottonwood Drive
Enrollment: 454 students
78.9% white, 1.9% Black or African American, 2.6% Asian, 10.0% Hispanic/Latino, 6.7% two or more races
Free and reduced-price lunch participation: 17.3% free, 3.6% reduced
Gifted: 17.3%
Statewide test scores (percentage who meet or exceed standards):��68 language arts, 60 math
Randolph

Randolph Elementary, 1024 S. 37th St.
Enrollment:��428 students
61.4% white, 0.9% American Indian or Alaska Native, 5.6% Black or African American, 3.7% Asian, 16.4% Hispanic/Latino, 0.5% Native Hawaiian or Pacific Islander, 11.4% two or more races
Free and reduced-lunch participation: 45.6% free, 8.9% reduced
Gifted: 3.0%
Statewide test scores (percentage who meet or exceed standards):��53 language arts, 40 math
Riley

Riley Elementary, 5021 Orchard St.
Enrollment: 321 students
49.5% white, 0.6% American Indian or Alaska Native, 6.9% Black or African American, 3.4% Asian, 22.7% Hispanic/Latino, 16.8% two or more races
Free and reduced-price lunch participation:��55.1% free, 10.0% reduced
Gifted:��5.3%
Statewide test scores (percentage who meet or exceed standards):��44 language arts, 42 math
Roper

Roper Elementary, 2323 S. Coddington
Enrollment: 803 students
53.5% white, 0.4% American Indian or Alaska Native, 9.9% Black or African American, 6.9% Asian, 21.2% Hispanic/Latino, 8.1% two or more races
Free and reduced-price lunch participation:��40.0% free, 10.4% reduced
Gifted:��6.5%
Statewide test scores (percentage who meet or exceed standards):��44 language arts, 46 math
Rousseau

Rousseau Elementary, 3701 S 33rd St.
Enrollment: 531 students
72.9% white, 0.2% American Indian or Alaska Native, 4.0% Black or African American, 3.4% Asian, 7.0% Hispanic/Latino, 0.2% Native Hawaiian or Pacific Islander, 12.2% two or more races
Free and reduced-price lunch participation: 22.7% free, 8.4% reduced
Gifted:��14.7%
Statewide test scores (percentage who meet or exceed standards):��68 language arts, 63 math
Saratoga
Saratoga Elementary, 2215 S. 13th St.
Enrollment: 235 students
48.5% white, 1.5% American Indian or Alaska Native, 7.8% Black or African American, 3.4% Asian, 26.2% Hispanic/Latino, 12.6% two or more races
Free and reduced-price lunch participation: 61.7% free, 9.7% reduced
Gifted:��5.8%
Statewide test scores (percentage who meet or exceed standards):��36 language arts, 25 math
Sheridan

Sheridan Elementary, 3100 Plymouth Ave.
Enrollment: 407 students
86.0% white, 0.2% American Indian or Alaska Native, 1.5% Black or African American, 0.5% Asian, 4.9% Hispanic/Latino, 6.9% two or more races
Free and reduced-price lunch participation: 12.0% free, 5.2% reduced
Gifted:��17.4%��
Statewide test scores (percentage who meet or exceed standards):��74 language arts, 64 math
West Lincoln

West Lincoln Elementary, 630 W. Dawes Ave.
Enrollment: 505 students
37.0% white, 0.4% American Indian or Alaska Native, 9.7% Black or African American, 2.4% Asian, 41.2% Hispanic, 9.3% two or more races
Free and reduced-price lunch participation: 72.1% free, 10.3% reduced
Gifted: 3.8%
Statewide test scores (percentage who meet or exceed standards): 32 language arts, 29 math
Wysong
Wysong Elementary, 7901 Blanchard Blvd.
Enrollment:��684 students
89.9% white, 0.1% Black or African American, 2.2% Asian, 3.8% Hispanic/Latino, 3.9% two or more races
Free and reduced-price lunch participation:��3.9% free, 1.5% reduced
Gifted:��7.5%
Statewide test scores (percentage who meet or exceed standards):��75 language arts, 68 math
Zeman

Zeman Elementary, 4900 S. 52nd St.
Enrollment: 440 students
63.0% white, 0.9% American Indian or Alaska Native, 4.8% Black or African American, 3.0% Asian, 16.1% Hispanic/Latino, 12.3% two or more races
Free and reduced-price lunch participation: 29.5% free, 9.3% reduced
Gifted:��3.4%
Statewide test scores (percentage who meet or exceed standards):��58 language arts, 49 math
Culler

Culler Middle School, 5201 Vine St.
Enrollment:��708 students
39.4% white, 1.0% American Indian or Alaska Native, 14.7% Black or African American, 7.1% Asian, 27.3% Hispanic/Latino, 0.1% Native Hawaiian or Pacific Islander, 10.5% two or more races
Free and reduced-price lunch participation: 60.9% free, 9.3% reduced
Gifted: 8.3%
Statewide test scores (percentage who meet or exceed standards):��32 language arts, 30 math
Dawes
Dawes Middle School, 5130 Colfax Ave.
Enrollment:��398 students
55.0% white, 0.3% American Indian or Alaska Native, 8.3% Black or African American, 2.3% Asian, 19.8% Hispanic/Latino, 14.3% two or more races
Free and reduced-price lunch participation: 53.3% free, 13.1% reduced
Gifted: 10.6%
Statewide test scores (percentage who meet or exceed standards): 37��language arts, 32 math
Goodrich

Goodrich Middle School, 4600 Lewis Ave.
Enrollment: 818 students
42.9% white, 1.1% American Indian or Alaska Native, 13.0% Black or African American, 4.0% Asian, 29.5% Hispanic/Latino, 9.5% two or more races
Free and reduced-price lunch participation:��61.6% free, 11.1% reduced
Gifted: 9.7%
Statewide test scores (percentage who meet or exceed standards):��36 language arts, 38 math
Irving

Irving Middle School, 2745 S. 22nd St.
Enrollment: 910 students
62.7% white, 0.8% American Indian or Alaska Native, 6.5% Black or African American, 3.2% Asian, 14.3% Hispanic/Latino, 12.5% two or more races
Free and reduced-price lunch participation: 35.4% free, 8.1% reduced
Gifted: 26.6%
Statewide test scores (percentage who meet or exceed standards):��55 language arts, 49 math
Lefler
Lefler Middle School, 1100 S. 48th St.
Enrollment:��558 students
57.9% white, 0.7% American Indian or Alaska Native, 9.5% Black or African American, 4.7% Asian, 15.8% Hispanic/Latino, 0.2% Native Hawaiian or Pacific Islander, 11.3% two or more races
Free and reduced-price lunch participation:��43.7% free, 12.0% reduced
Gifted: 13.8%
Statewide test scores (percentage who meet or exceed standards):��45 language arts, 45 math
Lux
Lux Middle School, 7800 High St.
Enrollment: 789 students
80.0% white, 0.1% American Indian or Alaska Native, 2.7% Black or African American, 3.8% Asian, 7.2% Hispanic/Latino, 0.1% Native Hawaiian or Pacific Islander, 6.1% two or more races
Free and reduced-price lunch participation: 10.5% free, 6.3% reduced
Gifted: 28.3%
Statewide test scores (percentage who meet or exceed standards): 66 language arts, 68 math
Mickle
Mickle Middle School, 2500 N. 67th St.
Enrollment: 719 students
70.9% white, 0.1% American Indian or Alaska Native, 2.8% Black or African American, 1.5% Asian, 11.8% Hispanic/Latino, 12.8% two or more races
Free and reduced-price lunch participation: 34.9% free, 9.5% reduced
Gifted: 17.1%
Statewide test scores (percentage who meet or exceed standards):��55 language arts, 53 math
Moore

Moore Middle School, 8700 Yankee Woods Drive
Enrollment:��646 students
86.4% white, 0.6% American Indian or Alaska Native, 0.6% Black or African American, 4.3% Asian, 3.4% Hispanic/Latino, 4.6% two or more races
Free and reduced-price lunch participation:��7.0% free, 2.3% reduced
Gifted: 27.6%
Statewide test scores (percentage who meet or exceed standards):��69 language arts, 78 math
Park
Park Middle School, 855 S. Eighth St.
Enrollment: 833 students
41.2% white, 0.6% American Indian or Alaska Native, 11.9% Black or African American, 6.7% Asian, 30.1% Hispanic/Latino, 0.2% Native Hawaiian or Pacific Islander, 9.2% two or more races
Free and reduced-price lunch participation: 55.8% free, 10.4% reduced
Gifted:��9.8%��
Statewide test scores (percentage who meet or exceed standards):��37 language arts, 37 math
Pound

Pound Middle School, 4740 S. 45th St.
Enrollment:��700 students
67.6% white, 0.6% American Indian or Alaska Native, 4.6% Black or African American, 2.4% Asian, 12.4% Hispanic/Latino, 0.1% Native Hawaiian or Pacific Islander, 12.3% two or more races
Free and reduced-price lunch participation: 25.7% free, 8.6% reduced
Gifted: 22.4%
Statewide test scores (percentage who meet or exceed standards):��59 language arts, 60 math
Schoo

Schoo Middle School, 700 Penrose Drive
Enrollment:��898 students
63.9% white, 0.4% American Indian or Alaska Native, 7.2% Black or African American, 5.0% Asian, 12.1% Hispanic/Latino, 0.1% Native Hawaiian or Pacific Islander, 11.1% two or more races
Free and reduced-price lunch participation: 30.3% free, 9.7% reduced
Gifted: 15.5%
Statewide test scores (percentage who meet or exceed standards):��50 language arts, 48 math
Scott

Scott Middle School, 2200 Pine Lake Road
Enrollment: 1,182 students
77.7% white, 0.2% American Indian or Alaska Native, 3.2% Black or African American, 4.6% Asian, 7.2% Hispanic/Latino, 7.1% two or more races
Free and reduced-price lunch participation: 13.1% free, 4.3% reduced
Gifted: 30.1%
Statewide test scores (percentage who meet or exceed standards):��65 language arts, 70 math
East
East High School, 1000 S. 70th St.
Enrollment: 2,250 students
78.7% white, 0.2% American Indian or Alaska Native, 2.2% Black or African American, 4.6% Asian, 8.4% Hispanic/Latino, 5.8% two or more races
Free and reduced-price lunch participation: 14.6% free, 5.3% reduced
Gifted: 24.4%
Statewide test scores (percentage who meet or exceed standards):��59 language arts, 58 math, 63 science
Lincoln High

Lincoln High School, 2229 J St.
Enrollment: 2,320 students
42.6% white, 1.7% American Indian or Alaska Native, 11.9% Black or African American, 8.9% Asian, 23.3% Hispanic/Latino, 0.1% Native Hawaiian or Pacific Islander, 11.5% two or more races
Free and reduced-price lunch participation: 47.5% free, 9.7% reduced
Gifted: 15.5%
Statewide test scores (percentage who meet or exceed standards):��36 language arts, 34 math, 34 science
North Star
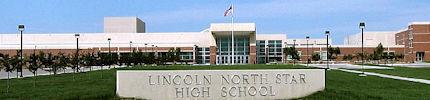
North Star High School, 5801 N. 33rd St.
Enrollment: 2,243 students
54.9% white, 0.4% American Indian or Alaska Native, 8.7% Black or African American, 6.5% Asian, 21.5% Hispanic/Latino, 7.9% two or more races
Free and reduced-price lunch participation: 42.1% free, 9.7% reduced
Gifted: 10.1%
Statewide test scores (percentage who meet or exceed standards):��29 language arts, 31 math, 34 science
Northeast
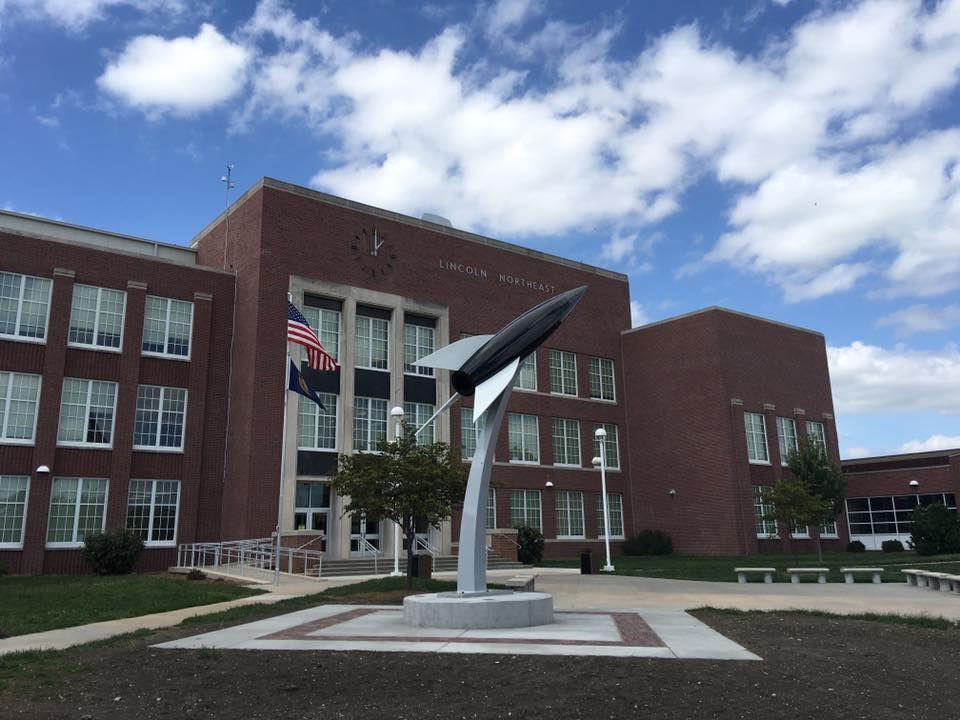
Northeast High School, 2635 N. 63rd St.
Enrollment: 1,869 students
59.4% white, 1.3% American Indian or Alaska Native, 9.7% Black or African American, 2.4% Asian, 17.1% Hispanic/Latino, 0.2% Native Hawaiian or Pacific Islander, 10.0% two or more races
Free and reduced-price lunch participation:��49.9% free, 10.8% reduced
Gifted:��10.6%
Statewide test scores (percentage who meet or exceed standards):��32 language arts, 30 math, 34 science
Southeast
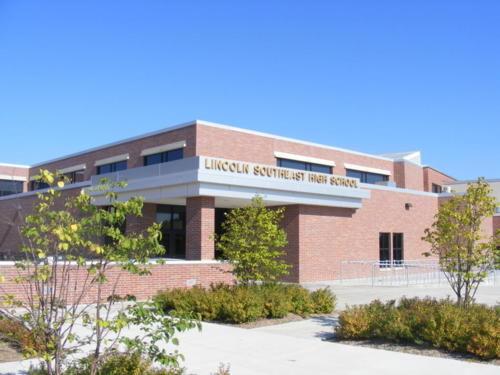
Southeast High School, 2930 S. 37th St.
Enrollment: 1,980 students
73.4% white, 1.1% American Indian or Alaska Native, 3.8% Black or African American, 1.2% Asian, 10.6% Hispanic/Latino, 0.3% Native Hawaiian or Pacific Islander, 9.6% two or more races
Free and reduced-price lunch participation: 25.1% free, 7.6% reduced
Gifted: 22.6%
Statewide test scores (percentage who meet or exceed standards):��49 language arts, 48 math, 53 science
Southwest
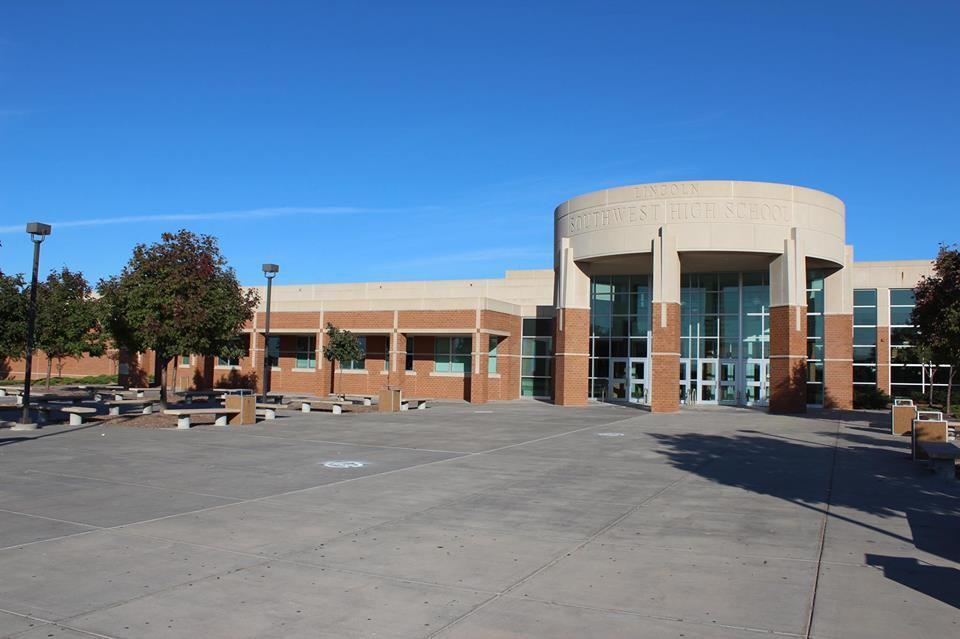
Southwest High School, 7001 S. 14th St.
Enrollment:��2,196 students
76.8% white, 0.2% American Indian or Alaska Native, 3.9% Black or African American, 3.8% Asian, 9.6% Hispanic/Latino, 5.7% two or more races
Free and reduced-price lunch participation: 17.7% free, 5.1% reduced
Gifted: 24.4%
Statewide test scores (percentage who meet or exceed standards):��62 language arts, 58 math, 64 science
Reach the writer at 402-473-7226 or��mreist@journalstar.com.
On Twitter @LJSreist.

Margaret Reist
Local government reporter


