


Millard North extended its streak of Class A state speech championships to five on Wednesday, edging runner-up Lincoln East by a 182-178 margin. York, the Class B champion, also claimed its fifth straight title in the team sweepstakes.
Celeste Cruz Rivera of Lincoln East (poetry) and Amani Al-Hamedia (entertainment) and Madison Ramey (serious) of third-place Lincoln Southwest won individual Class A events.
The state meet was staged Wednesday, Thursday and Friday at Kearney High School.
Other team sweepstakes winners were David City (C-1), Hartington-Newcastle (C-2), Wausa (D-1) and Stuart (D-2).
Here are the leading Class A finishers:
CLASS A
Team sweepstakes — 1. Millard North, 182; 2. Lincoln East, 178; 3. Lincoln Southwest, 88; 4. Lincoln Southeast, 86; 5. Bellevue West, 70.
People are also reading…
Poetry — 1. Celeste Cruz Rivera, Lincoln East; 2. Mac Vaverka, Lincoln East.
Entertainment — 1. Amani Al-Hamedia, Lincoln Southwest; 2. Maddie Hesse, Lincoln Southeast.
Informative — 1. Pranavi Athota, Millard North; 2. Adithi Deeduvanu, Millard North.
Serious — 1. Madison Ramey, Lincoln Southwest; 2. Sydney Kwasa, Millard North.
Drama — 1. Bennington (Selah Ryan, Avery Wells, Maddy Trotter, Addison Thornburg, Macy Petersen); 2. Lincoln East (Isabella Razdan, Max Apel, Jack Welstead, Harper Schupbach).
Persuasive — 1. Tamyia Bender, Bellevue West; 2. Amani Al-Hamedi, Lincoln Southwest.
Humorous — 1. Srilaasya Nedunoori, Millard North; 2. John Mentgen, Scottsbluff.
Duo — 1. Grand Island (Elaine Abrajan, Anne Martinez); 2. Elkhorn South (Federico Lesmes, Brenna Whitten).
Program — 1. Tamyia Bender, Bellevue West; 2. Sydney Kwasa, Millard North.
Extemporaneous — 1. Vikram Menon, Millard North; 2. Amelia Schwensen, Lincoln Southwest.
CLASS B
Team sweepstakes — 1. York, 146; 2. Gering, 94; 3. Ogallala, 76.
CHAMPIONS: Poetry — Jackson Schmid, York; Entertainment — Ben Drozd, Columbus Lakeview; Informative — Sam Schendt, Omaha Skutt; Serious — Kaitlyn Peterson, Gering; Drama — York (Hattie Chavanu, Dannika Lamberty, Cole Schmid, Trey Harms, Emma Nolan); Persuasive — Piper Dallmann, York; Humorous — Bronson Long, Gothenburg; Duet acting��— York (Trey Harms, Cole Schmid); Extemporaneous — Alex Hagestad, Elkhorn North.
CLASS C-1
Team sweepstakes��— 1. David City, 142; 2. Malcolm, 124; 3. Boone Central, 82.
CHAMPIONS: Poetry��— Hana Maddox, Malcolm;��Entertainment��— Elizabeth Wortmann, Crofton;��Informative��— Rachel Malander, Boone Central;��Serious��— Gracin Hahn, Tri County;��Drama��— Malcolm (Anna Schweitzer, Scarlett Battles, Cyrena Miller, Braxton Dalton, Karter Kinkaid);��Persuasive��— Eleanah Enevoldsen, Raymond Central;��Humorous��— Molly Kammerer, Sutherland;��Duet acting��— Malcolm (Ethan Wollberg, Tyler Thieman);��Extemporaneous��— Taylor Beierman, Boone Central.
CLASS C-2
Team sweepstakes��— 1. Hartington-Newcastle, 118; 2. Twin River, 70; 3. Elmwood-Murdock, 64.
CHAMPIONS: Poetry��— Sydney Mitchell, Alma;��Entertainment��— Greta Wooldrik, Guardian Angels CC;��Informative��— Brittani Gutz, Plainview;��Serious��— Reece Morten, Hartington-Newcastle;��Drama��— Hartington-Newcastle (Reece Morten, Parker Hopping, Carsen Hopping, Turner Dendinger, Bennet Sievers);��Persuasive��— Gavin Smith, Perkins County;��Humorous��— Lily Pope, Elmwood-Murdock;��Duet acting��— Loup City (Cameron Russell, Ellie Oxford);��Extemporaneous��— Ashlynn Hartman, Pawnee City.
CLASS D-1
Team sweepstakes��— 1. Wausa, 202; 2. Humphrey, 106; 3. Osmond, 102.
CHAMPIONS: Poetry��— Isabel Stallbaumer, Callaway;��Entertainment��— Trey McQuay, Wausa;��Informative��— Kenzie vonRentzell, Osmond;��Serious��— Tyler Baue, Wausa;��Drama��— Wausa (Leah Bloomquist, Abrielle Nelson, Cole Story, Trey McQuay, Tyler Baue);��Persuasive��— Emma Rankin, Riverside;��Humorous��— Megan Amos, Stapleton;��Duet acting��— Wausa (Tyler Baue, Cole Story);��Extemporaneous��— Jaylea Pope, Shelton.
CLASS D-2
Team sweepstakes��— 1. Stuart, 146; 2. Potter-Dix, 104; 3. Chambers 82.
CHAMPIONS: Poetry��— Damin Luedke, Paxton;��Entertainment��— William Paxton, Stuart;��Informative��— Mary Worthing, Arthur Co.;��Serious��— Payton Fitchner, St. Edward;��Drama��— Potter-Dix (Luke Kasten, Zach Rotert, Gunnar Olseson);��Persuasive��— Taya Schmaderer, Stuart;��Humorous��— Gradie Cunningham, Ansley;��Duet acting��— Arnold (Ella Cool, Reagan Cool);��Extemporaneous��— Tamika Eastman, Sioux Co.
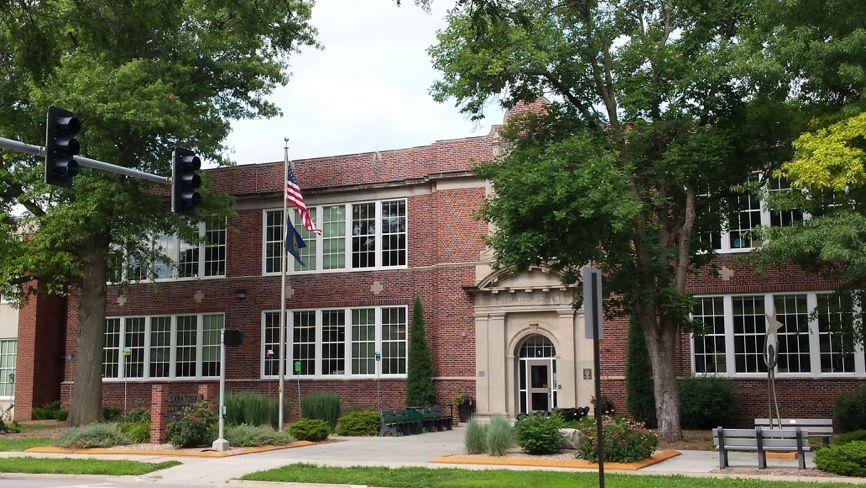
Breaking down Lincoln's public schools: Enrollment, test scores and more
Adams

Adams Elementary: 7401 Jacobs Creek Drive
Enrollment: 776 students
77.9% white, 2.3% Black or African American, 9.6% Asian, 4.9% Hispanic/Latino, 5.4% two or more races
Free and reduced-price lunch participation:��8.6% free, 2.3% reduced
Gifted students:��10.4%
Statewide test scores (percent who meet or exceed standards):��73 language arts; 76 math
Arnold
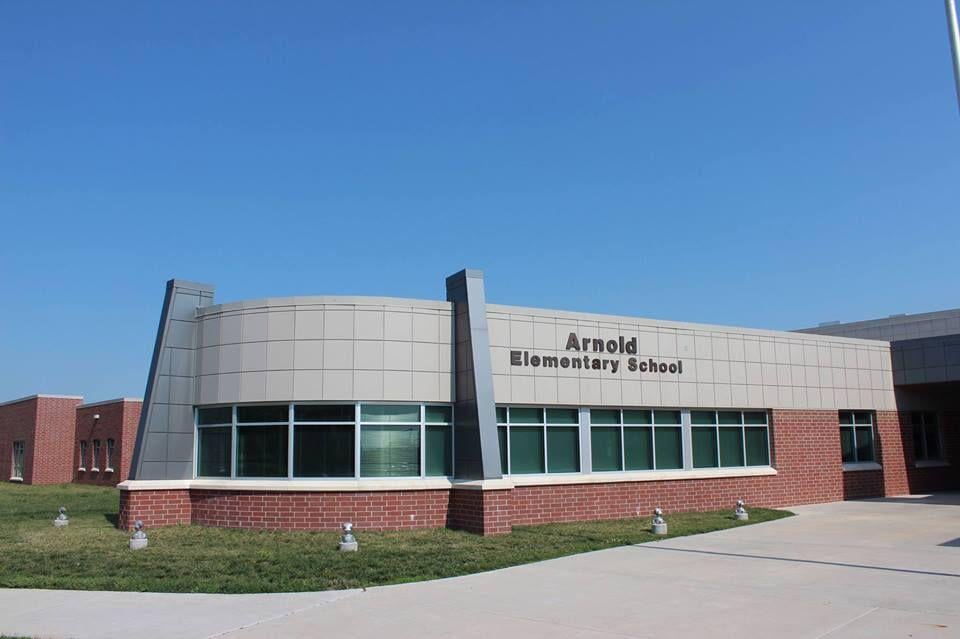
Arnold Elementary: 5000 Mike Scholl St.
Enrollment: 742 students
57.1% white, 1.5% American Indian or Alaska Native, 8.4% Black or African American, 1.5% Asian, 19.2% Hispanic/Latino, 0.3% Native Hawaiian or Pacific Islander, 12% two or more races
Free and reduced-price lunch participation:��46.7% free, 12.7% reduced
Gifted:��2.8%
Statewide test scores (percent who meet or exceed standards):��44 language arts, 32 math
Beattie

Beattie Elementary: 1901 Calvert St.
Enrollment: 368 students
73.6% white, 0.5% American Indian or Alaska Native, 3.3% Black or African American, 1.1% Asian, 8.2% Hispanic/Latino, 13.3% two or more races
Free or reduced-price lunch participation: 25.3% free, 8.2% reduced price
Gifted:��6.0%
Statewide test scores (percent who meet or exceed standards):��59 language arts, 55 math
Belmont

Belmont Elementary:��3425 N. 14th St.
Enrollment:��829 students
42.4% white, 0.9% American Indian or Alaska Native, 15.7% Black or African American, 2.2% Asian, 26.9% Hispanic/Latino, 11.8% two or more races
Free and reduced-price lunch participation: 67.5% free, 11.0% reduced
Gifted:��3.7%
Statewide test scores (percent who meet or exceed standards):��44 language arts, 34 math
Brownell
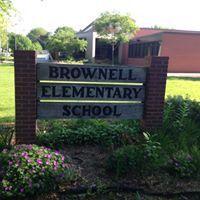
Brownell Elementary: 6000 Aylesworth Ave.
Enrollment: 320 students
65.9% white, 4.9% Black or African American, 0.3% Asian, 14.8% Hispanic/Latino, 14.1% two or more races
Free and reduced-price lunch participation:��45.2% free, 10.5% reduced
Gifted:��2.3%
Statewide test scores (percent who meet or exceed standards):��50 language arts, 37 math
Calvert
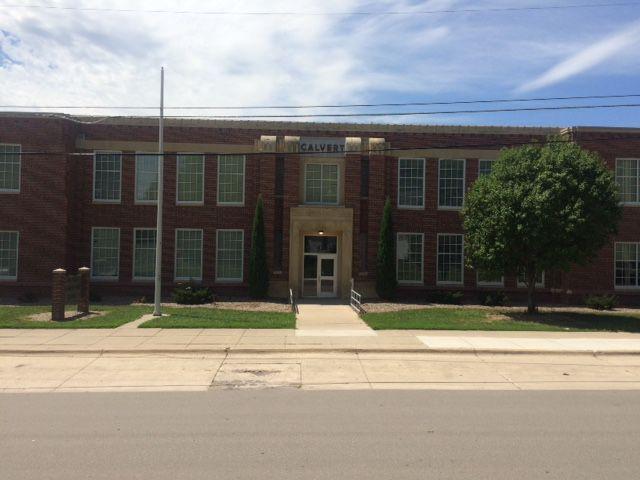
Calvert Elementary: 3709 S. 46th St.
Enrollment: 361 students
62.9% white, 1.2% American Indian or Alaska Native, 7.1% Black or African American, 1.5% Asian, 12.0% Hispanic/Latino, 15.3% two or more races
Free and reduced-price lunch participation: 45.7% free, 6.7% reduced
Gifted:��11.3%
Statewide test scores (percent who meet or exceed standards):��47 language arts, 31 math
Campbell

Campbell Elementary: 2200 Dodge St.
Enrollment: 591 students
46.6% white, 0.4% American Indian or Alaska Native, 14.3% Black or African American, 11.3% Asian, 16.6% Hispanic/Latino, 10.9% two or more races
Free and reduced-price lunch participation: 59.4% free, 10.5% reduced
Gifted: 4.2%
Statewide test scores (percent who meet or exceed standards):��38 language arts, 34 math
Cavett
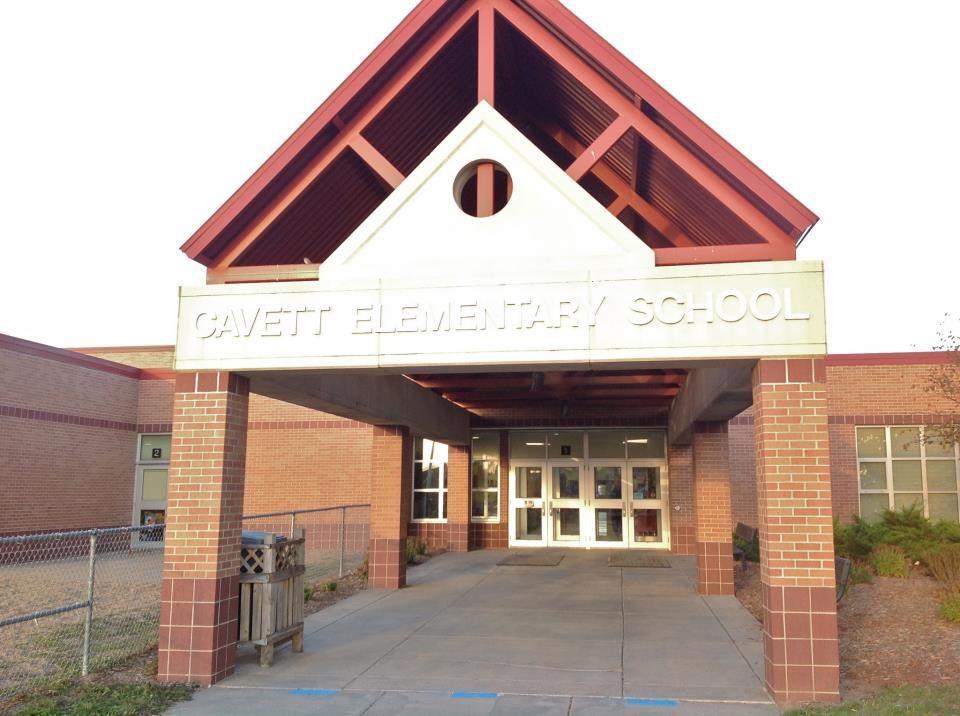
Cavett Elementary: 7701 S. 36th St.
Enrollment: 580 students
77.0% white, 0.5% American Indian or Alaska Native, 2.9% Black or African American, 4.0% Asian, 8.9% Hispanic, 6.6% two or more races
Free and reduced-price lunch participation:��10.4% free, 3.6% reduced
Gifted: 13.3%
Statewide test scores (percent who meet or exceed standards):��70 language arts, 69 math
Clinton
Clinton Elementary: 1520 N. 29th St.
Enrollment:��392 students
39.2% white, 0.3% American Indian or Alaska Native, 24.3% Black or African American, 4.7% Asian, 21.0% Hispanic/Latino, 10.5% two or more races
Free and reduced-price lunch participation: 81.2% free, 10.5% reduced
Gifted:��3.6%
Statewide test scores (percent who meet or exceed standards):��30 language arts, 30 math��
Eastridge

Eastridge Elementary: 6245 L St.
Enrollment:��291 students
72.9% white, 1.0% American Indian or Alaska Native, 4.5% Black or African American, 1.4% Asian, 10.3% Hispanic/Latino, 10.0% two or more races
Free and reduced-price lunch participation:��25.8% free, 10.0% reduced
Gifted:��7.9%
Statewide test scores (percent who meet or exceed standards):��55 language arts, 51 math
Elliott
Elliott Elementary: 225 S. 25th St.
Enrollment: 383 students
23.3% white, 1.8% American Indian or Alaska Native, 13.7% Black or African American, 12.8% Asian, 33.7% Hispanic/Latino, 0.3% Native Hawaiian or Pacific Islander, 14.3% two or more races
Free and reduced-price lunch participation: 76.4% free, 6.3% reduced
Gifted:��4.5%
Statewide test scores (percentage who meet or exceed standards):��42 language arts, 35 math
Everett
Everett Elementary: 1123 C St.
Enrollment: 374 students
27.8% white, 0.9% American Indian or Alaska Native, 13.5% Black or African American, 9.9% Asian, 40.4% Hispanic/Latino, 7.5% two or more races
Free and reduced-price lunch participation:��73.7% free, 8.7% reduced
Gifted:��5.4%
Statewide test scores (percentage who meet or exceed standards): 37 language arts, 24 math
Fredstrom

Fredstrom Elementary, 5700 N.W. 10th St.
Enrollment: 437 students
74.0% white, 0.5% American Indian or Alaska Native, 1.7% Black or African American, 3.6% Asian, 9.7% Hispanic, 10.4% two or more races
Free and reduced-price lunch participation: 22.3% free, 6.3% reduced
Gifted: 7.5%
Statewide test scores (percentage who meet or exceed standards):��52 language arts, 54 math
Hartley

Hartley Elementary, 730 N. 33rd St.
Enrollment:��339 students
37.5% white, 2.3% American Indian or Alaska Native, 17.5% Black or African American, 3.6% Asian, 25.9% Hispanic/Latino, 1.0% Native Hawaiian or Pacific Islander, 12.3% two or more races
Free and reduced-price lunch participation: 71.5% free, 9.4% reduced
Gifted:��3.2%
Statewide test scores (percentage who meet or exceed standards):��38 language arts, 28 math
Hill

Hill Elementary, 5230 Tipperary Trail
Enrollment:��449 students
72.2% white, 0.5% American Indian or Alaska Native, 4.8% Black or African American, 5.3% Asian, 10.3% Hispanic/Latino, 7.0% two or more races
Free and reduced-price lunch participation: 24.0% free, 5.0% reduced
Gifted: 10.3%
Statewide test scores (percentage who meet or exceed standards):��70 language arts, 59 math
Holmes

Holmes Elementary, 5230 Sumner St.
Enrollment: 393 students
70.7% white, 3.5% Black or African American, 3.5% Asian, 10.1% Hispanic/Latino, 0.3% Native Hawaiian or Pacific Islander, 11.9% two or more races
Free and reduced-price lunch participation:��37.1% free, 7.0% reduced
Gifted:��11.3%
Statewide test scores (percentage who meet or exceed standards):��61 language arts, 47 math
Humann
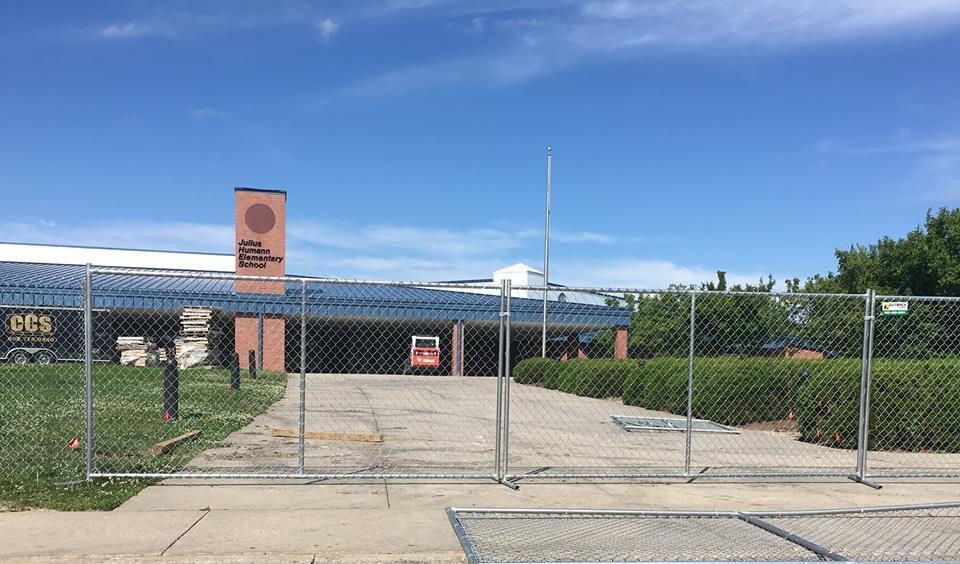
Humann Elementary,��6720 Rockwood Lane
Enrollment:��564 students
78.8% white, 0.6% American Indian or Alaska Native, 4.2% Black or African American, 1.3% Asian, 5.9% Hispanic/Latino, 9.3% two or more races
Free and reduced-price lunch participation: 23.9% free, 4.0% reduced
Gifted:��16.3%
Statewide test scores (percentage who meet or exceed standards):��72 language arts, 67 math
Huntington
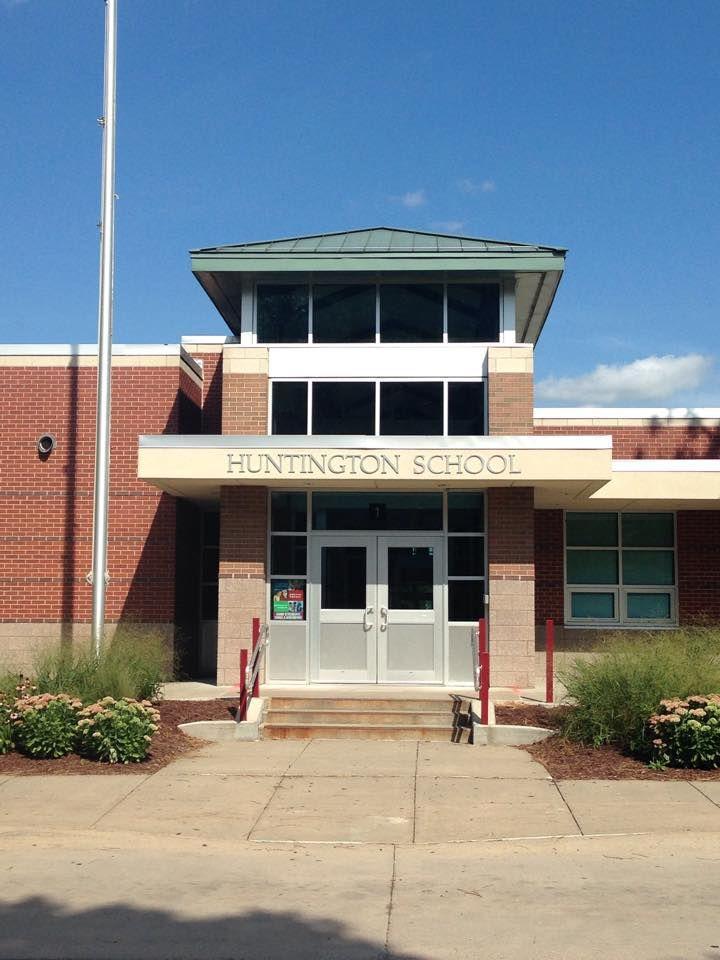
Huntington Elementary, 2900 N. 46th St.
Enrollment: 370 students
45.0% white, 0.6% American Indian or Alaska Native, 12.0% Black or African American, 1.5% Asian, 24.6% Hispanic/Latino, 16.2% two or more races
Free and reduced-price lunch participation:��67.0% free, 14.1% reduced
Gifted:��4.8%
Statewide test scores (percentage who meet or exceed standards):��32 language arts, 23 math
Kahoa

Kahoa Elementary, 7700 Leighton Ave.
Enrollment: 537 students
78.8% white, 0.4% American Indian or Alaska Native, 3.9% Black or African American, 2.6% Asian, 6.7% Hispanic/Latino, 7.6% two or more races
Free and reduced-price lunch participation: 22.9% free, 7.3% reduced
Gifted:��6.9%
Statewide test scores (percentage who meet or exceed standards):��66 language arts, 64 math
Kloefkorn
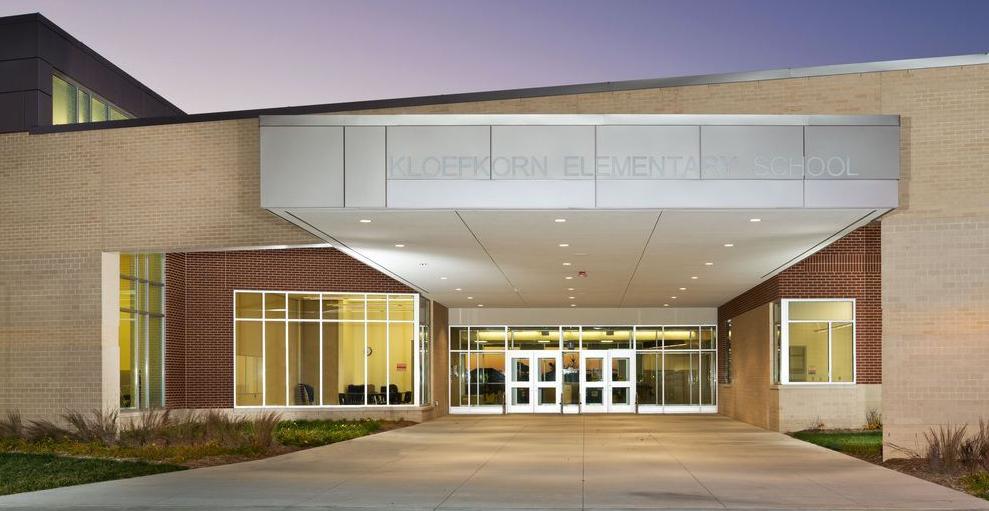
Kloefkorn Elementary, 6601 Glass Ridge Drive
Enrollment:��488 students
83.7% white, 0.7% American Indian or Alaska Native, 1.5% Black or African American, 4.4% Asian, 5.3% Hispanic/Latino, 4.4% two or more races
Free and reduced-price lunch participation:��6.2% free, 2.0% reduced
Gifted: 11.9%
Statewide test scores (percentage who meet or exceed standards):��77 language arts, 72 math
Kooser

Kooser Elementary, 7301 N. 13th St.
Enrollment:��821 students
63.5% white, 0.1% American Indian or Alaska Native, 5.6% Black or African American, 11.9% Asian, 11.1% Hispanic/Latino, 0.1% Native Hawaiian or Pacific Islander, 7.6% two or more races
Free and reduced-price lunch participation:��30.0% free, 8.3% reduced
Gifted: 2.9%
Statewide test scores (percentage who meet or exceed standards): 55 language arts, 49 math
Lakeview

Lakeview Elementary, 300 Capitol Beach Blvd.
Enrollment:��400 students
53.0% white, 0.8% American Indian or Alaska Native, 9.3% Black or African American, 3.8% Asian, 22.8% Hispanic/Latino, 10.5% two or more races
Free and reduced-price lunch participation: 57.0% free, 9.5% reduced
Gifted: 1.8%
Statewide test scores (percentage who meet or exceed standards): 35��language arts, 29 math
Maxey

Maxey Elementary, 5200 S. 75th St.
Enrollment: 683 students
75.9% white, 0.3% American Indian or Alaska Native, 1.2% Black or African American, 13.5% Asian, 3.4% Hispanic/Latino, 0.2% Native Hawaiian or Pacific Islander, 5.5% two or more races
Free and reduced-price lunch participation: 10.6% free, 3.4% reduced
Gifted: 10.4%
Statewide test scores (percentage who meet or exceed standards):��70 language arts, 69 math
McPhee

McPhee Elementary, 820 Goodhue Blvd.
Enrollment:��304 students
26.8% white, 1.4% American Indian or Alaska Native, 16.3% Black or African American, 12.7% Asian, 35.9% Hispanic/Latino and 6.9% two or more races
Free and reduced-price lunch participation: 77.2% free, 6.9% reduced
Gifted:��4.0%
Statewide test scores (percentage who meet or exceed standards):��36 language arts, 22 math
Meadow Lane

Meadow Lane Elementary,��7200 Vine St.
Enrollment:��620 students
72.1% white, 0.2% American Indian or Alaska Native, 2.8% Black or African American, 2.6% Asian, 13.8% Hispanic/Latino, 8.6% two or more races
Free and reduced-price lunch participation: 33.6% free, 8.1% reduced
Gifted:��8.3%
Statewide test scores (percentage who meet or exceed standards):��51 language arts, 39 math
Morley

Morley Elementary, 6800 Monterey Drive
Enrollment:��421 students
78.1% white, 0.2% American Indian or Alaska Native, 3.8% Black or African American, 0.2% Asian, 7.4% Hispanic, 0.5% Native Hawaiian or Pacific Islander, 9.7% two or more races
Free and reduced-price lunch participation:��20.2% free, 5.5% reduced
Gifted: 15.4%
Statewide test scores (percentage who meet or exceed standards): 69��language arts, 56 math
Norwood Park
Norwood Park Elementary, 4710 N. 72nd St.
Enrollment: 238 students
68.0% white, 4.4% Black or African American, 2.4% Asian, 18.9% Hispanic/Latino, 6.3% two or more races
Free and reduced-price lunch participation: 46.6% free, 15.0% reduced
Gifted:��4.9%
Statewide test scores (percentage who meet or exceed standards):��43 language arts, 30 math
Pershing

Pershing Elementary, 6402 Judson St.
Enrollment: 430 students
57.5% white, 0.5% American Indian or Alaska Native, 6.6% Black or African American, 3.3% Asian, 20.6% Hispanic/Latino, 11.5% two or more races
Free and reduced-price lunch participation: 54.5% free, 12.7% reduced
Gifted:��4.3%
Statewide test scores (percentage who meet or exceed standards):��49 language arts, 50 math
Prescott

Prescott Elementary, 1930 S. 20th St.
Enrollment: 492 students
44.9% white, 0.9% American Indian or Alaska Native, 13.8% Black or African American, 7.3% Asian, 18.8% Hispanic/Latino, 0.5% Native Hawaiian or Pacific Islander, 13.8% two or more races
Free and reduced-price lunch participation: 51.2% free, 9.5% reduced
Gifted: 7.5%
Statewide test scores (percentage who meet or exceed standards):��52 language arts, 36 math
Pyrtle
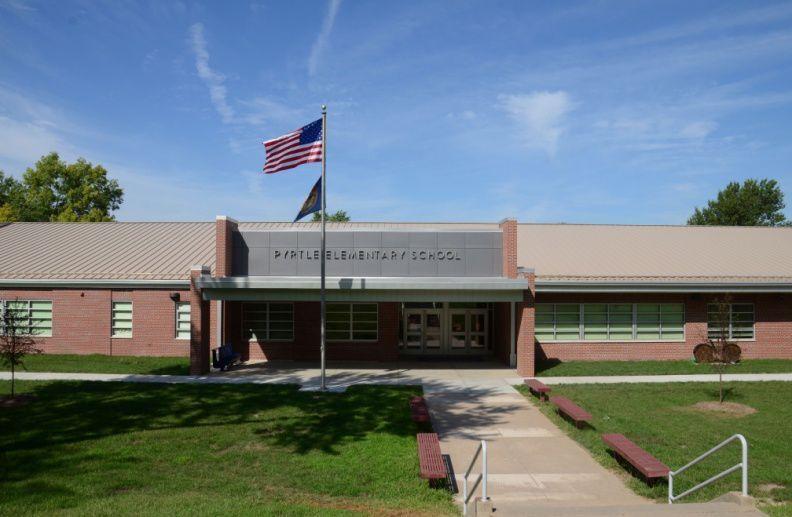
Pyrtle Elementary, 721 Cottonwood Drive
Enrollment: 454 students
78.9% white, 1.9% Black or African American, 2.6% Asian, 10.0% Hispanic/Latino, 6.7% two or more races
Free and reduced-price lunch participation: 17.3% free, 3.6% reduced
Gifted: 17.3%
Statewide test scores (percentage who meet or exceed standards):��68 language arts, 60 math
Randolph

Randolph Elementary, 1024 S. 37th St.
Enrollment:��428 students
61.4% white, 0.9% American Indian or Alaska Native, 5.6% Black or African American, 3.7% Asian, 16.4% Hispanic/Latino, 0.5% Native Hawaiian or Pacific Islander, 11.4% two or more races
Free and reduced-lunch participation: 45.6% free, 8.9% reduced
Gifted: 3.0%
Statewide test scores (percentage who meet or exceed standards):��53 language arts, 40 math
Riley

Riley Elementary, 5021 Orchard St.
Enrollment: 321 students
49.5% white, 0.6% American Indian or Alaska Native, 6.9% Black or African American, 3.4% Asian, 22.7% Hispanic/Latino, 16.8% two or more races
Free and reduced-price lunch participation:��55.1% free, 10.0% reduced
Gifted:��5.3%
Statewide test scores (percentage who meet or exceed standards):��44 language arts, 42 math
Roper

Roper Elementary, 2323 S. Coddington
Enrollment: 803 students
53.5% white, 0.4% American Indian or Alaska Native, 9.9% Black or African American, 6.9% Asian, 21.2% Hispanic/Latino, 8.1% two or more races
Free and reduced-price lunch participation:��40.0% free, 10.4% reduced
Gifted:��6.5%
Statewide test scores (percentage who meet or exceed standards):��44 language arts, 46 math
Rousseau

Rousseau Elementary, 3701 S 33rd St.
Enrollment: 531 students
72.9% white, 0.2% American Indian or Alaska Native, 4.0% Black or African American, 3.4% Asian, 7.0% Hispanic/Latino, 0.2% Native Hawaiian or Pacific Islander, 12.2% two or more races
Free and reduced-price lunch participation: 22.7% free, 8.4% reduced
Gifted:��14.7%
Statewide test scores (percentage who meet or exceed standards):��68 language arts, 63 math
Saratoga
Saratoga Elementary, 2215 S. 13th St.
Enrollment: 235 students
48.5% white, 1.5% American Indian or Alaska Native, 7.8% Black or African American, 3.4% Asian, 26.2% Hispanic/Latino, 12.6% two or more races
Free and reduced-price lunch participation: 61.7% free, 9.7% reduced
Gifted:��5.8%
Statewide test scores (percentage who meet or exceed standards):��36 language arts, 25 math
Sheridan

Sheridan Elementary, 3100 Plymouth Ave.
Enrollment: 407 students
86.0% white, 0.2% American Indian or Alaska Native, 1.5% Black or African American, 0.5% Asian, 4.9% Hispanic/Latino, 6.9% two or more races
Free and reduced-price lunch participation: 12.0% free, 5.2% reduced
Gifted:��17.4%��
Statewide test scores (percentage who meet or exceed standards):��74 language arts, 64 math
West Lincoln

West Lincoln Elementary, 630 W. Dawes Ave.
Enrollment: 505 students
37.0% white, 0.4% American Indian or Alaska Native, 9.7% Black or African American, 2.4% Asian, 41.2% Hispanic, 9.3% two or more races
Free and reduced-price lunch participation: 72.1% free, 10.3% reduced
Gifted: 3.8%
Statewide test scores (percentage who meet or exceed standards): 32 language arts, 29 math
Wysong
Wysong Elementary, 7901 Blanchard Blvd.
Enrollment:��684 students
89.9% white, 0.1% Black or African American, 2.2% Asian, 3.8% Hispanic/Latino, 3.9% two or more races
Free and reduced-price lunch participation:��3.9% free, 1.5% reduced
Gifted:��7.5%
Statewide test scores (percentage who meet or exceed standards):��75 language arts, 68 math
Zeman

Zeman Elementary, 4900 S. 52nd St.
Enrollment: 440 students
63.0% white, 0.9% American Indian or Alaska Native, 4.8% Black or African American, 3.0% Asian, 16.1% Hispanic/Latino, 12.3% two or more races
Free and reduced-price lunch participation: 29.5% free, 9.3% reduced
Gifted:��3.4%
Statewide test scores (percentage who meet or exceed standards):��58 language arts, 49 math
Culler

Culler Middle School, 5201 Vine St.
Enrollment:��708 students
39.4% white, 1.0% American Indian or Alaska Native, 14.7% Black or African American, 7.1% Asian, 27.3% Hispanic/Latino, 0.1% Native Hawaiian or Pacific Islander, 10.5% two or more races
Free and reduced-price lunch participation: 60.9% free, 9.3% reduced
Gifted: 8.3%
Statewide test scores (percentage who meet or exceed standards):��32 language arts, 30 math
Dawes
Dawes Middle School, 5130 Colfax Ave.
Enrollment:��398 students
55.0% white, 0.3% American Indian or Alaska Native, 8.3% Black or African American, 2.3% Asian, 19.8% Hispanic/Latino, 14.3% two or more races
Free and reduced-price lunch participation: 53.3% free, 13.1% reduced
Gifted: 10.6%
Statewide test scores (percentage who meet or exceed standards): 37��language arts, 32 math
Goodrich

Goodrich Middle School, 4600 Lewis Ave.
Enrollment: 818 students
42.9% white, 1.1% American Indian or Alaska Native, 13.0% Black or African American, 4.0% Asian, 29.5% Hispanic/Latino, 9.5% two or more races
Free and reduced-price lunch participation:��61.6% free, 11.1% reduced
Gifted: 9.7%
Statewide test scores (percentage who meet or exceed standards):��36 language arts, 38 math
Irving

Irving Middle School, 2745 S. 22nd St.
Enrollment: 910 students
62.7% white, 0.8% American Indian or Alaska Native, 6.5% Black or African American, 3.2% Asian, 14.3% Hispanic/Latino, 12.5% two or more races
Free and reduced-price lunch participation: 35.4% free, 8.1% reduced
Gifted: 26.6%
Statewide test scores (percentage who meet or exceed standards):��55 language arts, 49 math
Lefler
Lefler Middle School, 1100 S. 48th St.
Enrollment:��558 students
57.9% white, 0.7% American Indian or Alaska Native, 9.5% Black or African American, 4.7% Asian, 15.8% Hispanic/Latino, 0.2% Native Hawaiian or Pacific Islander, 11.3% two or more races
Free and reduced-price lunch participation:��43.7% free, 12.0% reduced
Gifted: 13.8%
Statewide test scores (percentage who meet or exceed standards):��45 language arts, 45 math
Lux
Lux Middle School, 7800 High St.
Enrollment: 789 students
80.0% white, 0.1% American Indian or Alaska Native, 2.7% Black or African American, 3.8% Asian, 7.2% Hispanic/Latino, 0.1% Native Hawaiian or Pacific Islander, 6.1% two or more races
Free and reduced-price lunch participation: 10.5% free, 6.3% reduced
Gifted: 28.3%
Statewide test scores (percentage who meet or exceed standards): 66 language arts, 68 math
Mickle
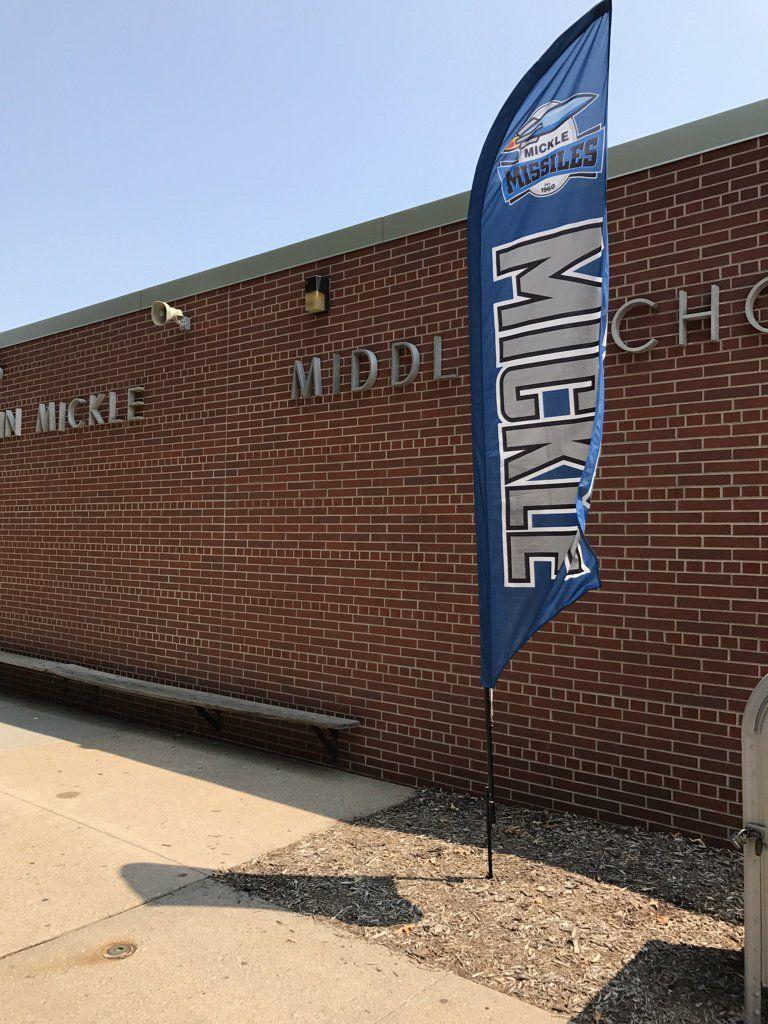
Mickle Middle School, 2500 N. 67th St.
Enrollment: 719 students
70.9% white, 0.1% American Indian or Alaska Native, 2.8% Black or African American, 1.5% Asian, 11.8% Hispanic/Latino, 12.8% two or more races
Free and reduced-price lunch participation: 34.9% free, 9.5% reduced
Gifted: 17.1%
Statewide test scores (percentage who meet or exceed standards):��55 language arts, 53 math
Moore

Moore Middle School, 8700 Yankee Woods Drive
Enrollment:��646 students
86.4% white, 0.6% American Indian or Alaska Native, 0.6% Black or African American, 4.3% Asian, 3.4% Hispanic/Latino, 4.6% two or more races
Free and reduced-price lunch participation:��7.0% free, 2.3% reduced
Gifted: 27.6%
Statewide test scores (percentage who meet or exceed standards):��69 language arts, 78 math
Park
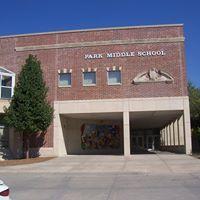
Park Middle School, 855 S. Eighth St.
Enrollment: 833 students
41.2% white, 0.6% American Indian or Alaska Native, 11.9% Black or African American, 6.7% Asian, 30.1% Hispanic/Latino, 0.2% Native Hawaiian or Pacific Islander, 9.2% two or more races
Free and reduced-price lunch participation: 55.8% free, 10.4% reduced
Gifted:��9.8%��
Statewide test scores (percentage who meet or exceed standards):��37 language arts, 37 math
Pound

Pound Middle School, 4740 S. 45th St.
Enrollment:��700 students
67.6% white, 0.6% American Indian or Alaska Native, 4.6% Black or African American, 2.4% Asian, 12.4% Hispanic/Latino, 0.1% Native Hawaiian or Pacific Islander, 12.3% two or more races
Free and reduced-price lunch participation: 25.7% free, 8.6% reduced
Gifted: 22.4%
Statewide test scores (percentage who meet or exceed standards):��59 language arts, 60 math
Schoo

Schoo Middle School, 700 Penrose Drive
Enrollment:��898 students
63.9% white, 0.4% American Indian or Alaska Native, 7.2% Black or African American, 5.0% Asian, 12.1% Hispanic/Latino, 0.1% Native Hawaiian or Pacific Islander, 11.1% two or more races
Free and reduced-price lunch participation: 30.3% free, 9.7% reduced
Gifted: 15.5%
Statewide test scores (percentage who meet or exceed standards):��50 language arts, 48 math
Scott

Scott Middle School, 2200 Pine Lake Road
Enrollment: 1,182 students
77.7% white, 0.2% American Indian or Alaska Native, 3.2% Black or African American, 4.6% Asian, 7.2% Hispanic/Latino, 7.1% two or more races
Free and reduced-price lunch participation: 13.1% free, 4.3% reduced
Gifted: 30.1%
Statewide test scores (percentage who meet or exceed standards):��65 language arts, 70 math
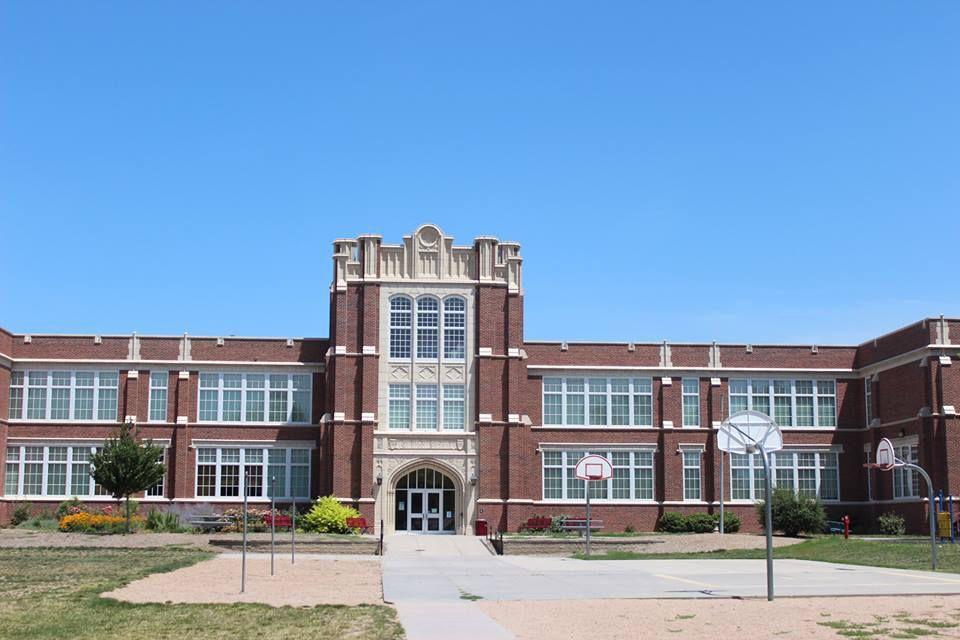
East
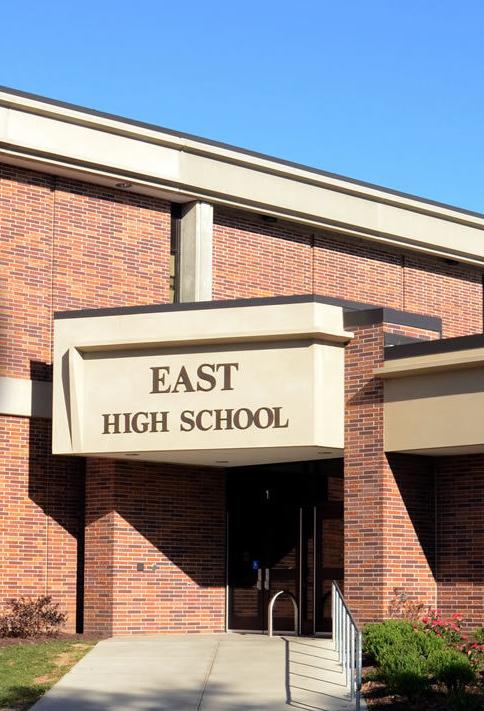
East High School, 1000 S. 70th St.
Enrollment: 2,250 students
78.7% white, 0.2% American Indian or Alaska Native, 2.2% Black or African American, 4.6% Asian, 8.4% Hispanic/Latino, 5.8% two or more races
Free and reduced-price lunch participation: 14.6% free, 5.3% reduced
Gifted: 24.4%
Statewide test scores (percentage who meet or exceed standards):��59 language arts, 58 math, 63 science
Lincoln High

Lincoln High School, 2229 J St.
Enrollment: 2,320 students
42.6% white, 1.7% American Indian or Alaska Native, 11.9% Black or African American, 8.9% Asian, 23.3% Hispanic/Latino, 0.1% Native Hawaiian or Pacific Islander, 11.5% two or more races
Free and reduced-price lunch participation: 47.5% free, 9.7% reduced
Gifted: 15.5%
Statewide test scores (percentage who meet or exceed standards):��36 language arts, 34 math, 34 science
North Star
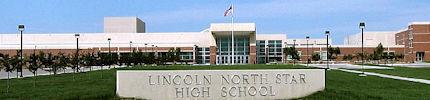
North Star High School, 5801 N. 33rd St.
Enrollment: 2,243 students
54.9% white, 0.4% American Indian or Alaska Native, 8.7% Black or African American, 6.5% Asian, 21.5% Hispanic/Latino, 7.9% two or more races
Free and reduced-price lunch participation: 42.1% free, 9.7% reduced
Gifted: 10.1%
Statewide test scores (percentage who meet or exceed standards):��29 language arts, 31 math, 34 science
Northeast
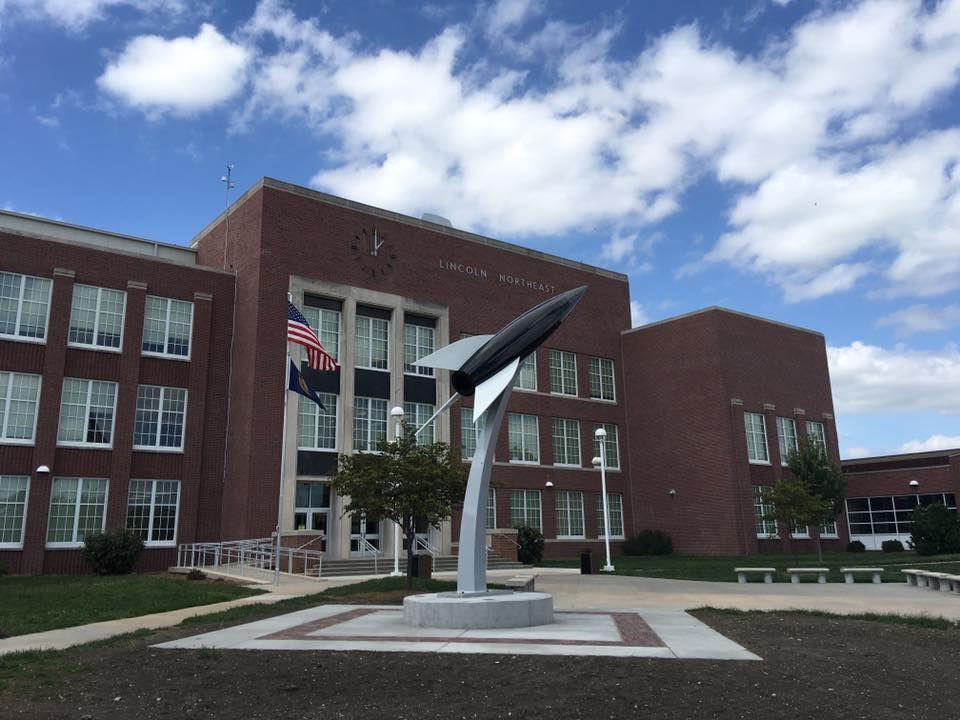
Northeast High School, 2635 N. 63rd St.
Enrollment: 1,869 students
59.4% white, 1.3% American Indian or Alaska Native, 9.7% Black or African American, 2.4% Asian, 17.1% Hispanic/Latino, 0.2% Native Hawaiian or Pacific Islander, 10.0% two or more races
Free and reduced-price lunch participation:��49.9% free, 10.8% reduced
Gifted:��10.6%
Statewide test scores (percentage who meet or exceed standards):��32 language arts, 30 math, 34 science
Southeast
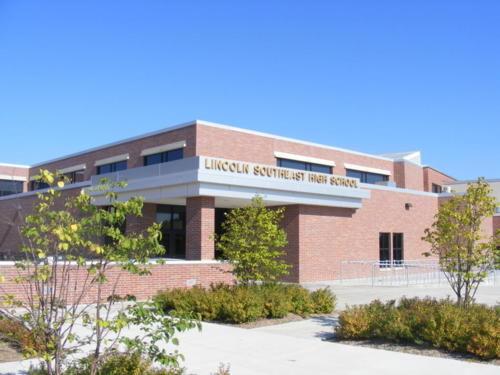
Southeast High School, 2930 S. 37th St.
Enrollment: 1,980 students
73.4% white, 1.1% American Indian or Alaska Native, 3.8% Black or African American, 1.2% Asian, 10.6% Hispanic/Latino, 0.3% Native Hawaiian or Pacific Islander, 9.6% two or more races
Free and reduced-price lunch participation: 25.1% free, 7.6% reduced
Gifted: 22.6%
Statewide test scores (percentage who meet or exceed standards):��49 language arts, 48 math, 53 science
Southwest
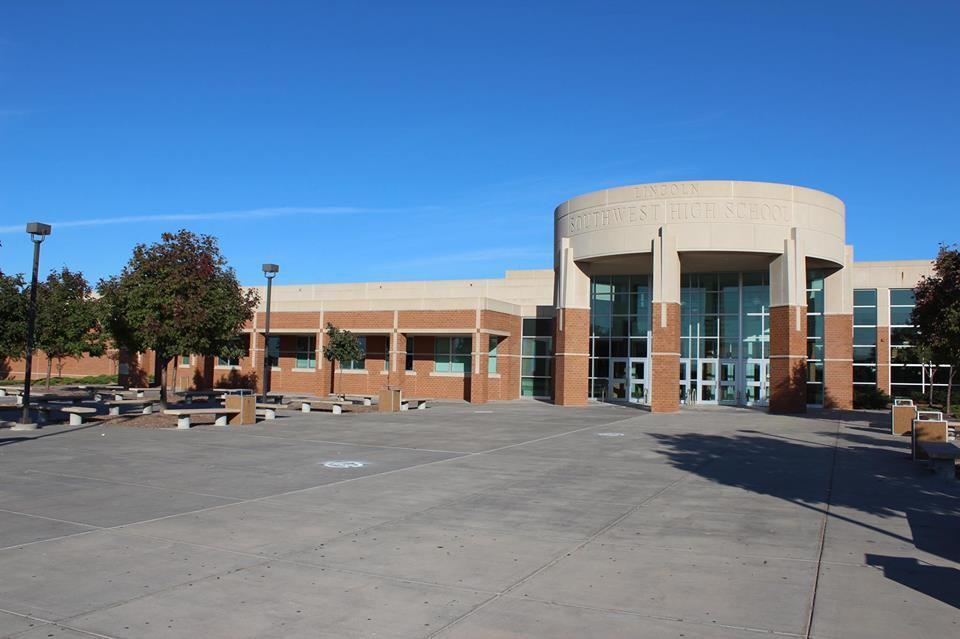
Southwest High School, 7001 S. 14th St.
Enrollment:��2,196 students
76.8% white, 0.2% American Indian or Alaska Native, 3.9% Black or African American, 3.8% Asian, 9.6% Hispanic/Latino, 5.7% two or more races
Free and reduced-price lunch participation: 17.7% free, 5.1% reduced
Gifted: 24.4%
Statewide test scores (percentage who meet or exceed standards):��62 language arts, 58 math, 64 science


